Table of Contents
Understanding the Structure of Natural Gas Investment

Investment in natural gas should not simply rely on the news.
Data analysis based on time plays a crucial role.
Rather than depending solely on corporate performance like stocks, factors such as weather, demand, supply, storage levels, and speculative tendencies affect prices in real time.
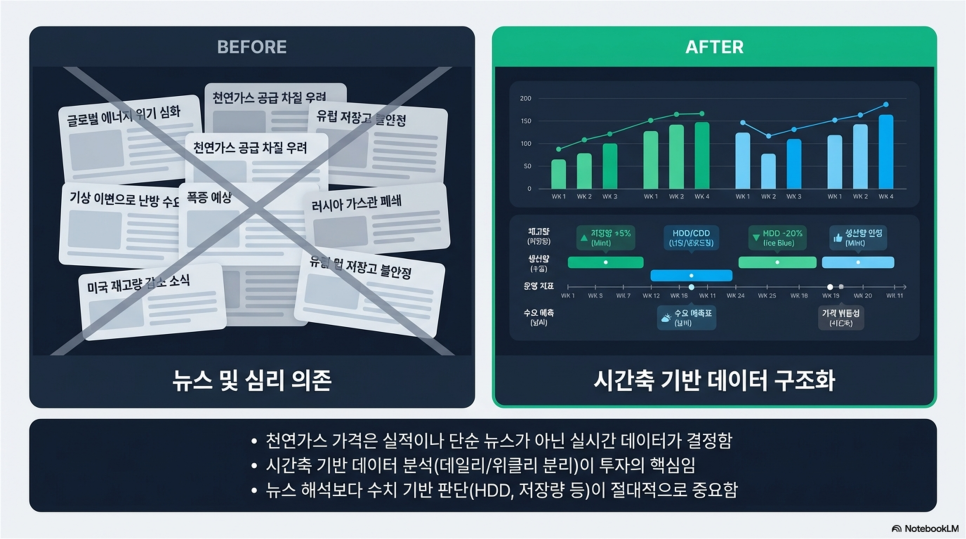
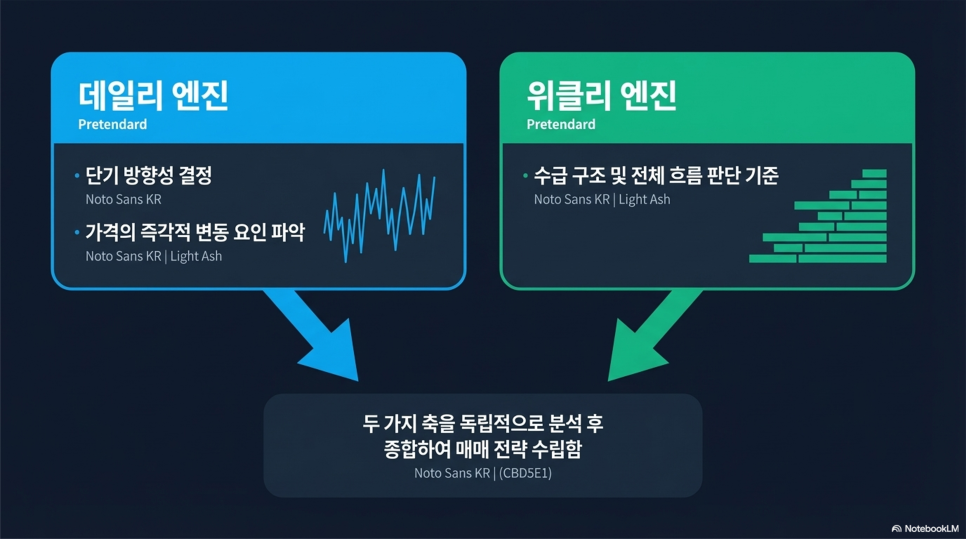
Investors should divide their investment approach into short-term and medium-term perspectives. In the short term, it is important to identify immediate price fluctuation factors, while in the medium term, the focus should be on analyzing the overall market trends.
In particular, it should be recognized that in the natural gas market, data-driven judgments based on numbers such as HDD, CDD, storage levels, and production figures carry more weight than news interpretations. This approach will lead to more effective investment decisions.
Summary of Daily Key Variables
It is essential to carefully watch the factors that determine the price volatility for today and tomorrow.
Confirming the three crucial points is key.
1) Weather (GFS·ECMWF, HDD·CDD)
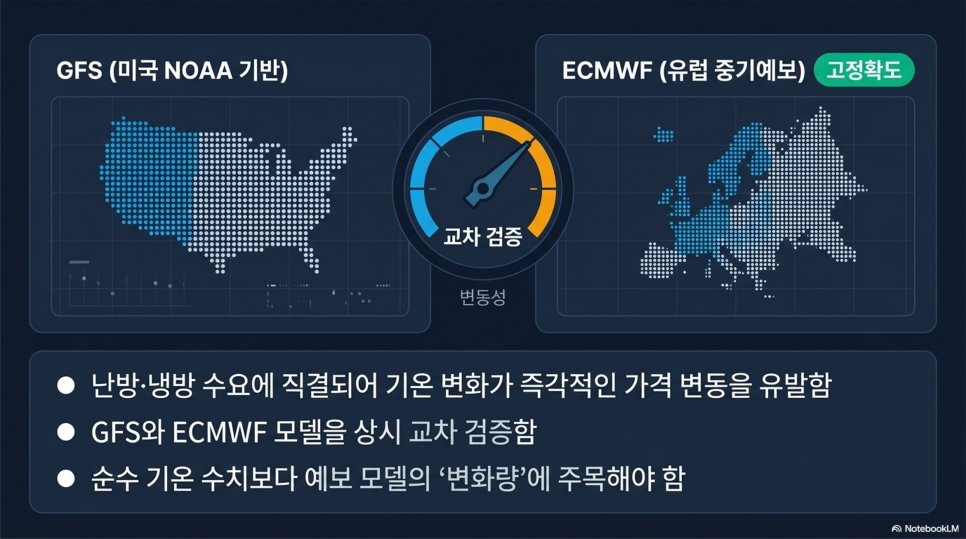
The most critical factor can be said to be the weather. The need for natural gas is directly affected by heating and cooling, as temperature changes correlate with demand. As a result, changes in demand lead to price fluctuations.
GFS is a global forecasting model based on the U.S. NOAA, while ECMWF is a European medium-term forecasting model known for its accuracy. These two models play an important role in weather prediction.
Importantly, it is not just simple temperature changes.
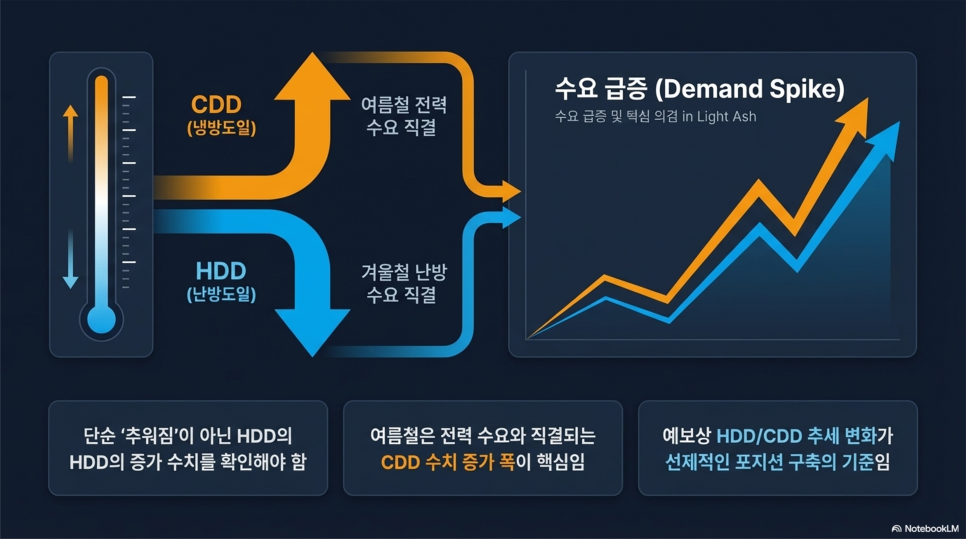
HDD (Heating Degree Days) increases as demand for heating rises in winter, whereas CDD (Cooling Degree Days) increases with higher electricity demand in summer.
Therefore, investors should closely monitor the changes in HDD rather than merely noting that "it has gotten colder."
2) Physical Flows (Supply·Demand)

Natural gas prices are greatly influenced by physical flows. Thus, it is important to check the following three indicators simultaneously.
First, production levels indicate the current supply situation. Second, power burn, which refers to gas consumption for power generation, is considered a key demand indicator. Finally, LNG Feed Gas refers to the gas exported overseas, which is another critical factor.
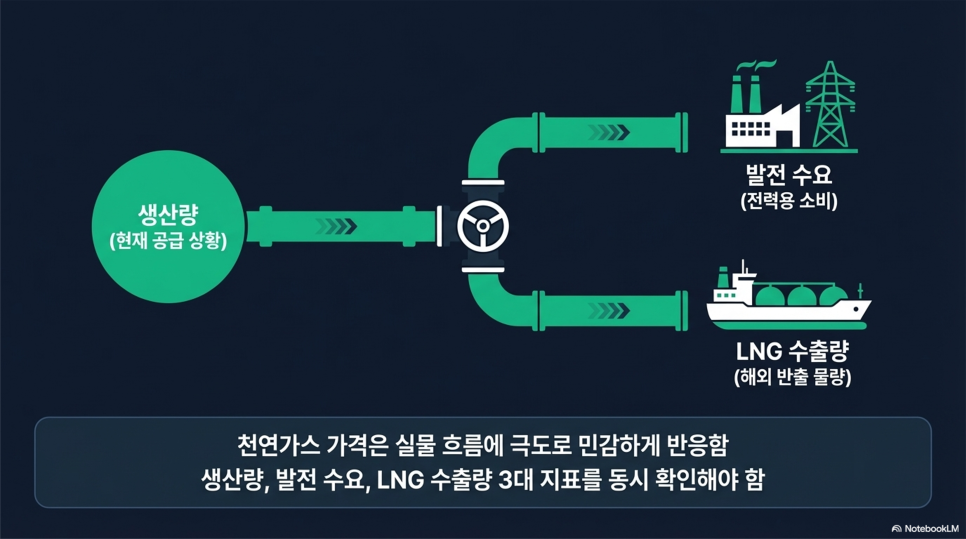
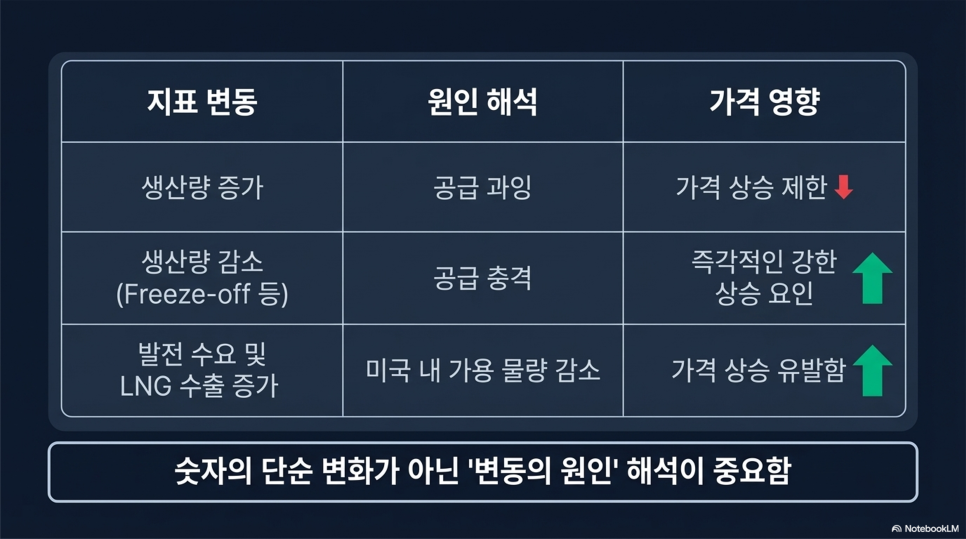
When production increases, price rises are limited. Conversely, a decrease in production can strongly drive up prices. Additionally, an increase in power burn leads to higher demand and consequently rising prices. A decline in LNG supply in the U.S. results in price increases. Therefore, analyzing the causes behind numerical changes is essential.
3) Equipment and Event Variables
There are various events to note daily.
These include maintenance of LNG terminals, pipeline-related issues, and weather events like cold waves or heatwaves.
These factors are the main causes of sudden price fluctuations in the short term.
Analysis of Weekly Key Data
The weekly timeframe is critical in determining the market direction.
EIA Storage Report Analysis
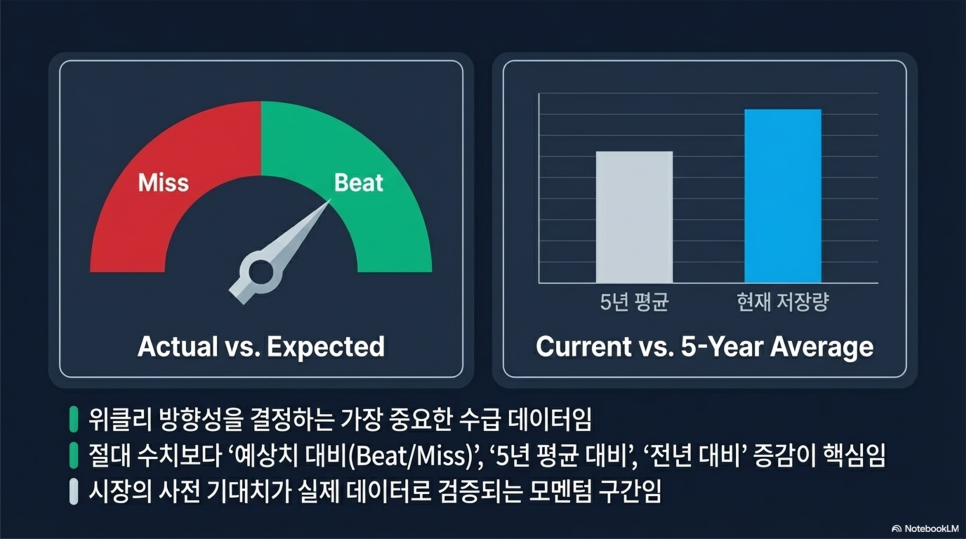
The most noteworthy event in the natural gas market is the EIA's storage report.
The key point here is not the absolute numbers but the comparative items. The differences from forecasts, the five-year averages, and comparisons with the previous year are crucial.
For instance, if the injection volume is lower than expected, it indicates a bullish signal, whereas, conversely, if the withdrawal volume is lower than anticipated, it indicates a bearish signal.
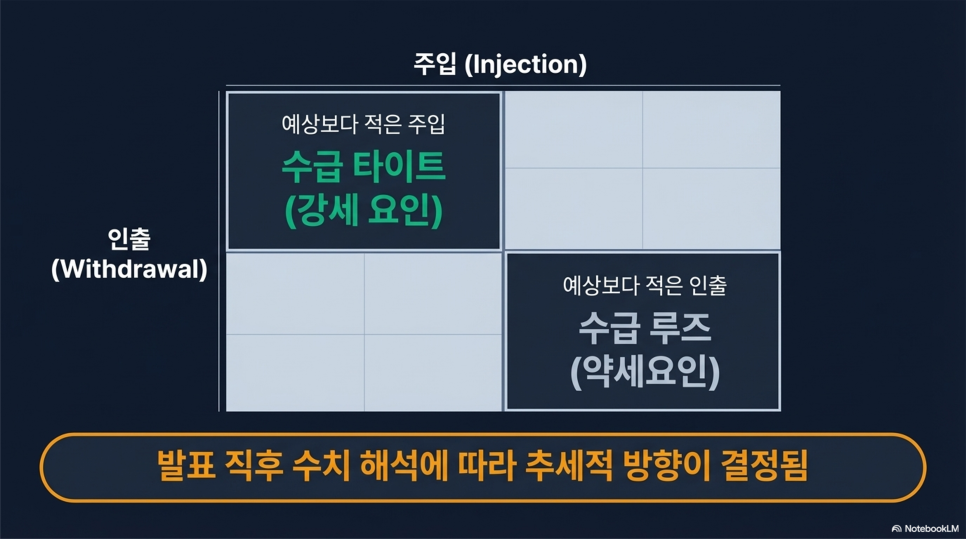
The criteria for evaluating storage levels change based on whether the supply-demand situation is tight or loose.
Additionally, storage data plays a crucial role in assessing whether market expectations are met.
Baker Hughes Rig Count
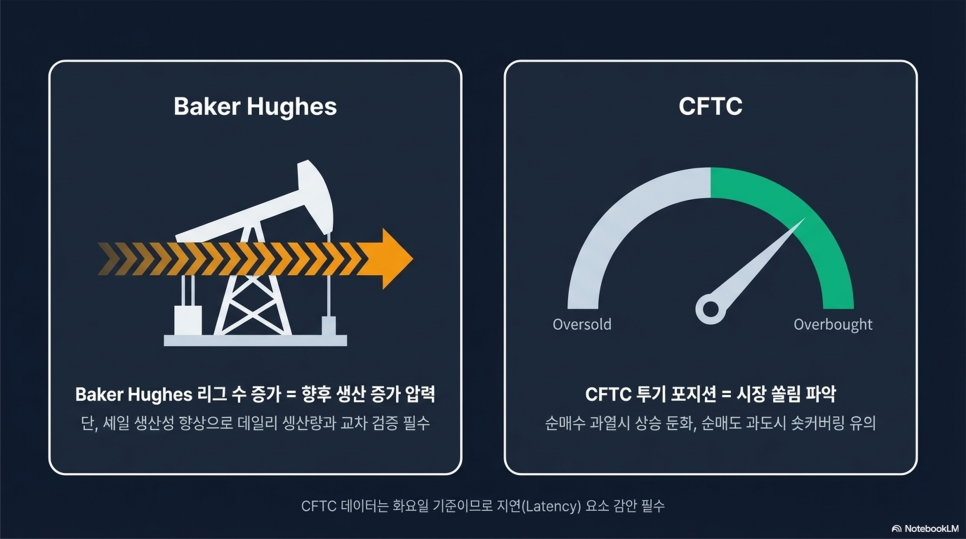
The rig count serves as an important leading indicator of future supply trends.
If the rig count increases, there is likely to be an increase in production, whereas a decrease in the rig count may slow down supply.
However, due to recent improvements in shale productivity, it should be noted that there is not a direct relationship between rig count and actual production.
Therefore, it is essential to analyze daily production data for accurate judgments.
CFTC Speculative Positions
The CFTC COT report indicates the market's imbalances. Excessive net buying can suggest a slowing of the upward trend, while excessive net selling may lead to a rise due to short covering.
However, this data is provided as of Tuesday, so it should be kept in mind that it has a delayed effect.
Summary of Natural Gas Investment Checklist
If you are a real investor, the structure below is sufficient to respond adequately.
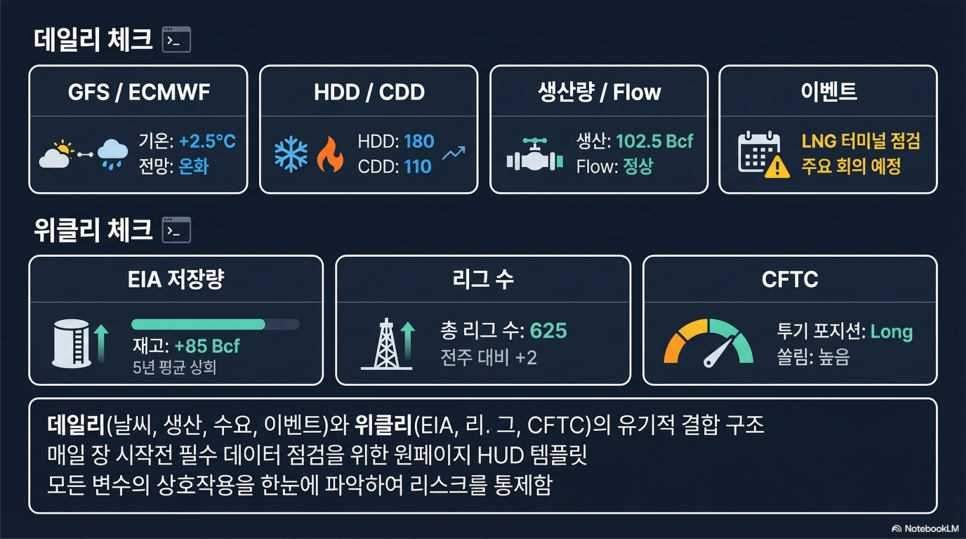
The daily items to check include changes in GFS and ECMWF, fluctuations in HDD and CDD, production levels, electricity consumption, LNG supply gas, equipment, and events.
The weekly items to check should include EIA storage levels, Baker Hughes rig counts, and changes in CFTC positions.
These factors form the basic framework for natural gas investment.
Conclusion Summary of Natural Gas Investment

The method of investing in the natural gas market is not merely reliant on news, but rather, a supply-demand analysis based on data is crucial.
The core elements in this field can be summarized into three points. First, through daily data analysis, determine the short-term direction by considering weather and actual volume flows. Second, analyze the market structure through weekly data such as storage levels, rig counts, and positions. Third, it is always necessary to interpret the flow of "numbers → causes → price impacts."
By adhering to these principles, it becomes possible to make investments that can clearly explain the reasons behind price changes without being swayed by short-term price fluctuations.
Ultimately, the most important aspect of natural gas investment is not the quantity of information, but the ability to interpret that information structurally.
#naturalgasinvestment, #naturalgasforecast, #EIAstoragereport, #HenryHub, #naturalgasETF, #energyinvestment, #commodityinvestment, #LNGmarket, #powerburn, #LNGFeedGas, #gasproduction, #BakerHughes, #rigcount, #CFTCpositions, #speculativepositions, #GFSweather, #ECMWFforecast, #HDDCDD, #weatherinvestment, #commodityanalysis, #energysector, #USnaturalgas, #gasSupplyandDemand, #inflationhedge, #commoditytrading, #ETFinvestmentstrategy, #marketanalysis, #investmentstrategy, #macroeconomics, #energytrading
Frequently Asked Questions (FAQ)
Q. What data analysis is important for natural gas investment?
Natural gas investment requires analyzing various real-time data like weather, demand and supply, storage levels, and speculative tendencies.
Natural gas investment should not simply rely on news or corporate performance but requires systematic analysis of continuously changing weather information, temperature change indicators like HDD and CDD, production levels, electricity consumption, LNG export volumes, and market variables like storage levels, rig counts, and CFTC positions. These data are key causes of price fluctuations and provide the essential framework for investment judgments.
Q. How do short-term and medium-term approaches differ in natural gas investment?
Short-term focuses on immediate price fluctuation factors, while medium-term focuses on overall market trend analysis.
Short-term approaches mainly examine factors directly influencing prices in real time, such as weather changes, HDD and CDD fluctuations, equipment issues, and events. In contrast, the medium-term perspective considers weekly data like EIA storage reports, Baker Hughes rig counts, and CFTC positions to gauge market direction. These two approaches complement each other in understanding the market.
Q. What weather data has the most significant impact on natural gas price fluctuations?
Forecasts from GFS and ECMWF models and HDD, CDD indicators significantly influence prices.
GFS is a global weather forecasting model provided by the U.S. NOAA, while ECMWF is a European-based medium-term forecasting model that accurately predicts temperature changes. In particular, HDD (Heating Degree Days) reflects increased heating demand in winter, while CDD (Cooling Degree Days) reflects increased cooling demand in summer, directly impacting natural gas demand and price fluctuations. Investors should focus on the changes in these figures rather than simple temperature readings for more effective judgment.
Q. What key indicators should be monitored in physical flows?
Production levels, power burn consumption, and LNG export volumes (LNG Feed Gas).
Production levels indicate the current supply situation, and when production increases, price rises are limited. Power Burn is the measure of gas consumption for electricity and is a core demand indicator; as consumption increases, upward pressure on prices arises. LNG Feed Gas indicates overseas export quantities, which act as a factor for price increases when reduced. Therefore, it is necessary to simultaneously monitor these three physical indicators to accurately assess supply and demand situations.
Q. What should be the focus when reviewing the EIA storage report?
It is important to compare the expected figures with the five-year average and year-over-year storage changes.
The EIA storage report's key points are not just the numbers themselves but rather the differences between expected values and actual figures, as well as comparisons with the past five years' averages and last year's storage. For instance, if the injection volume is lower than expected, it signals a bullish market, while a lower than expected withdrawal volume can indicate a bearish market. The assessment of storage levels is crucial for determining whether supply-demand balances are tight or loose and validating whether market expectations were met.
Q. How to utilize the relationship between Baker Hughes' rig count and actual production?
The rig count indicates production trends, but it does not always correlate directly with actual production due to enhanced shale productivity.
Rig counts typically serve as leading indicators for predicting supply increases or decreases. If the rig count increases, it suggests potential production increases, and if it declines, it reflects concerns regarding supply slowdowns. However, in recent times, advancements in shale gas production technology have weakened the direct relationship between rig counts and actual production levels, emphasizing the need to analyze daily production data for accurate judgments.
Q. What role does CFTC position data play in investment decisions?
It indicates market imbalances and potential slowing of upward trends or prospects for short covering.
The CFTC COT report provides insight into the status of net buying and selling positions of speculative and hedging participants. When net buying is overheated, it may suggest a slowing of the upward trend, while excessive net selling could lead to upward movements due to short covering. However, this data is reported as of Tuesday, meaning it has some delay, which must be considered in investment strategies.
Q. What is the basic checklist for natural gas investment?
Daily checks include weather (GFS, ECMWF), HDD, CDD, production levels, electricity consumption, LNG supply, and events, while weekly checks include storage levels, rig counts, and position changes.
Key daily variables to monitor include changes in GFS and ECMWF weather models, temperature indicators like HDD and CDD, gas production levels, power burn consumption, LNG supply amounts, and equipment maintenance or weather events. Weekly check items include the EIA storage report, Baker Hughes rig counts, and changes in CFTC speculative positions. This checklist allows for systematic investment judgments and market responses.
Q. What is the most important ability in natural gas investment?
The ability to structurally interpret information and understand the flow of numbers → causes → price impact.
While the natural gas market contains a lot of information within news, the key aspect is not the sheer volume of information but rather the ability to analyze it systematically. By interpreting supply and market structures based on data, understanding the hidden causes behind numerical changes, and how those impacts are reflected in prices, one can establish a solid investment strategy that remains robust against volatility. This ability is ultimately essential for successful natural gas investment.