Table of Contents
- Attention SOXL Investors! Scenarios for Recovery of Previous Peaks and Role of the SOX Index
- Basic Understanding and Current Status of SOXL ETF and the Philadelphia Semiconductor Index (SOX)
- The Complexity of Leveraged ETFs: Why SOXL Cannot Simply Track 3x SOX Index
- Analysis of Major Past Highs of SOXL and the SOX Index at that Time: Important Lessons
- Estimated Scenarios for SOX Index Targets for SOXL to Recover Previous Highs
- Beyond Simple Calculations: The Need for Rational Judgment in SOXL Recovery
Attention SOXL Investors! Scenarios for Recovery of Previous Peaks and Role of the SOX Index

As volatility in the semiconductor industry increases, investor interest in the Direxion Daily Semiconductor Bull 3X Shares, abbreviated as SOXL ETF, is growing.
In particular, many questions arise about the extent to which the underlying index, the Philadelphia Semiconductor Index, or the SOX index, needs to rise for SOXL to recapture its past peak. However, predicting the movements of a 3x leveraged ETF like SOXL requires complex analysis that goes beyond simple calculations.
In previous posts, we have analyzed leveraged ETFs related to AI, robotics, and quantum computing. In this post, we will investigate the possibility of SOXL breaking through its historical high among IT-related leveraged ETFs. To do this, we will delve deeply into the theoretical targets for the SOX index and various realistic factors.
Through this analysis, we aim to provide clearer direction for SOXL's investment strategy; thus, interested readers are encouraged to keep following along.

Leveraged ETFs are unlikely to achieve simple 3x returns of the underlying index in the long term.
I want to emphasize that various factors, such as volatility drag and path dependency, must be considered. These characteristics can significantly impact investment strategies.
Basic Understanding and Current Status of SOXL ETF and the Philadelphia Semiconductor Index (SOX)

SOXL is a leveraged ETF that seeks to deliver 3x the daily return of the SOX index, which consists of 30 major semiconductor companies listed on the U.S. Philadelphia Stock Exchange. Because of its potential for high returns, it carries significant risks, making it a product that primarily investors with confidence in short-term market forecasts strategically select. SOXL's annual management fee is set at approximately 0.75%.
The SOX index has established itself as a benchmark for the semiconductor industry, calculated using market-capitalization-weighted prices of companies involved in semiconductor design, manufacturing, distribution, and sales. As of the close on May 16, 2025, the current price of SOXL stands at approximately $18.39, and the SOX index is around 4922.19.
Meanwhile, the historical peak of the SOX index was recorded at 5931.83 on July 10, 2024, indicating strong growth of the index. SOXL underwent a 15-for-1 stock split on March 2, 2021, so when making historical price comparisons, adjusted figures must be referenced. Because of these characteristics, SOXL is considered an attractive option for investors with strong confidence in the semiconductor industry.
The Complexity of Leveraged ETFs: Why SOXL Cannot Simply Track 3x SOX Index
There is a tendency among investors to believe that SOXL tracks the daily return of the SOX index at 3x. This often leads to expectations of a 3x cumulative return during long-term holding, but this is a misunderstanding. Such misunderstandings arise from the characteristics of leveraged ETFs.
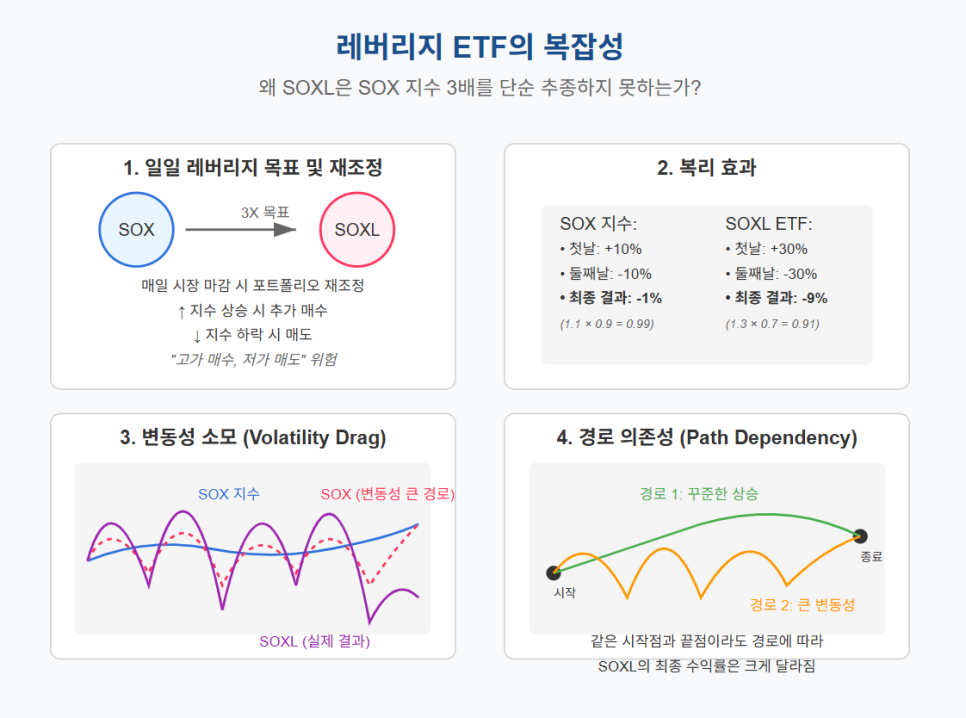
First, daily leverage targets and portfolio rebalancing are important. SOXL adjusts its portfolio to achieve performance corresponding to three times the daily fluctuation of the SOX index at the close of each trading day. If the index rises, it buys more, and if it falls, it sells, which can lead to situations of "buying high and selling low," potentially negatively impacting long-term performance.
Second, there is the effect of compounding. Since daily returns are calculated on a compounding basis, discrepancies arise between the cumulative returns of the underlying index and the leveraged ETF. For example, if the index rises by 10% on the first day and falls by 10% the next day, a loss of 1% occurs relative to the principal. However, a 3x leveraged ETF would rise by 30% on the first day and then fall by 30% the next day, resulting in a greater loss of 9% relative to the principal.
Third, there exists volatility drag or beta slippage. When the underlying index exhibits high volatility with repeated ups and downs, leveraged ETFs like SOXL, even when the underlying index finally rises, tend to decline in value rather than keeping pace with this rise. This effect is pronounced when combined with daily rebalancing and the effect of compounding, becoming more evident with increased volatility.
Finally, there is the concept of path dependency. The final return of SOXL is significantly influenced not only by the start and end points of the SOX index but also by the path that the index takes over that period. If the index consistently rises, there is a possibility of achieving returns close to or exceeding 3x; however, during situations of high volatility with sideways markets or rebounds after drops, performance may fall short of expectations. Comprehensive consideration of these factors aids in making investment decisions regarding leveraged ETFs.
Analysis of Major Past Highs of SOXL and the SOX Index at that Time: Important Lessons
Analyzing the periods of highest peaks of SOXL and observing the corresponding changes in the SOX index greatly aids in understanding the characteristics of leveraged ETFs. This analysis also serves as crucial foundational material for developing future market outlooks.

In early January 2022, SOXL recorded a peak price of approximately $73.98 on a split-adjusted basis. At that time, the SOX index was approximately 3946.16, which was the closing price of the same day. As time progressed into July 2024, SOXL reached approximately $70.08, and the SOX index at that time set an all-time high of 5931.83.
Comparing these two points in time, it is evident that while the SOX index rose about 50.3% by July 2024 compared to January 2022, SOXL's peak price dropped by 5.3% from $73.98 to $70.08. This clearly shows that for SOXL to surpass its previous high again, the SOX index needs to increase significantly more than before.
This case well illustrates how volatility drag and compounding effect manifest in the long term. Ultimately, it serves as a prime example of how market volatility and increases in the underlying asset impact the performance of investment products. Through such analyses, investors will better understand market trends and be aided in formulating strategies.
Estimated Scenarios for SOX Index Targets for SOXL to Recover Previous Highs
With SOXL currently priced at $18.39, questions arise regarding how much the SOX index must rise to recover past major highs. Several possibilities can be estimated, but these calculations are mere simplifications that do not account for volatility. It is essential to keep in mind that a much higher index level may be required in reality. These variables must be considered when making investments.

Scenario 1: SOXL Recovery of Highest Price ($70.08) in July 2024
Calculating the required return for SOXL, we find that ($70.08 - $18.39) / $18.39 * 100% leads to approximately 281.08%. Hence, based on a simple 3x leverage, the required return for SOX is about 281.08% divided by 3, resulting in approximately 93.69%. Therefore, the theoretical target SOX index could be established at approximately 9533.96 by multiplying 4922.19 by (1 + 0.9369).
Historically, the SOX index rose by 50.3% during the formation of past peaks for SOXL. If this is applied to the current situation, the SOX index must rise at least 50.3% from the current 4922.19 to about 7400.05 to establish a meaningful peak for SOXL. However, in this scenario, considering simple 3x leverage, SOXL would only reach about $46.14, significantly below the target of $70.08. This suggests that the past growth rates of the SOX index are merely a reference, and calculations based on SOXL's required returns are more rational.
Realistically, if we assume an effective leverage of 2.0x, the SOX index would need to rise to approximately 11839.45. If the effective leverage were 1.5x, the target SOX index would rise to an astonishing 14145.96.
This analysis emphasizes that when formulating an investment strategy for SOXL, it is essential to incorporate not only historical data but also current market conditions into return calculations. Investors should base realistic targets on these figures and appropriately respond to market volatility.
Scenario 2: SOXL Recovery of Highest Price ($73.98) in January 2022
The required return for SOXL can be calculated as follows: ($73.98 - $18.39) / $18.39 * 100% yields approximately 302.28%.
Applying simple 3x leverage here, the required SOX return computes to approximately 100.76%. Theoretically, the target SOX index is then established at around 9881.38 by multiplying 4922.19 by (1 + 1.0076).
However, keep in mind that these figures may underestimate the required SOX index, considering volatility. For instance, if the effective leverage is set at 2.0, the target SOX index could be approximately 12361.
Thus, it is crucial to adequately consider these factors when investing.
Beyond Simple Calculations: The Need for Rational Judgment in SOXL Recovery

In conclusion, accurately predicting the target SOX index for SOXL to recover its previous peak is a very challenging task. The target SOX index derived from simple 3x calculations (approximately 9500–9900) serves as a minimal reference point that does not take volatility and path dependency into account.
Historical cases reveal that the level of the SOX index necessary for SOXL to form new peaks tends to rise over time. For example, when SOXL peaked in July 2024, the SOX index was about 50.3% higher than it was in January 2022. This suggests that for SOXL to reach similar peak levels in the future, the SOX index not only needs to surpass its current historical high of 5931.83 but also demonstrate strong upward movement well beyond that, possibly to over 11800–14000 points.
To invest in leveraged ETFs like SOXL over the long term, it is essential to have a clear understanding of the product's structure and risks. Therefore, it is crucial to strategically utilize such products based on short-term market outlooks but always make informed investment decisions. We hope this analysis aids SOXL investors in making beneficial judgments.
#SOXL, #SOX, #Philadelphia Semiconductor Index, #Leveraged ETF, #Semiconductor Investment, #ETF Investment, #Investment Strategy, #Financial Technology, #Stock Investment, #US Stocks, #Semiconductor ETF, #3x Leverage, #SOXL Outlook, #SOX Index, #SOXL Target Price, #SOXL Previous High, #Investment Risk, #Volatility Drag, #Beta Slippage, #Path Dependency, #Compound Effect, #Short-term Investment, #Strategic Investment, #Portfolio, #Asset Allocation, #Market Analysis, #Economic Outlook, #Semiconductor Cycle, #Tech Stocks, #Growth Stocks